How to View Step-Wise Message Analytics in Reflys?
Reflys provides you with clear, step-by-step message analytics, allowing you to understand exactly how each automation flow, WhatsApp campaign, or Messenger broadcast is performing. Instead of guessing what works, you can track message delivery, open rates, link clicks, and conversion actions, all from inside your Reflys dashboard.
These insights show you where customers are dropping off, how to increase message engagement, and what those analytics tell you about future broadcasts or automation workflows.
Whether you’re running an automated flow, onboarding series, or lead generation campaign, every message step is easily measurable and comparable in Reflys analytics.
Key Benefits of Reflys Analytics
Analytics are vital in monitoring how well the automation flows end up increasing your revenue. Here are a few of the analytics you can track on your Reflys dashboard!
1. Track Complete Message Performance
Get visibility into how many people received, opened, or interacted with every step of your automation.
2. Optimize Engagement
Identify which messages perform better and which need improvement—without manual guesswork.
3. Improve Conversions
Understand user behavior across each message step, helping you fix drop-offs and improve funnel results.
4. Compare Flows & Messages
Each flow shows accurate step-wise performance, letting you compare results between different automation sequences.
5. Real-Time Monitoring
Monitor how messages perform as soon as they are sent—no delays, no waiting.
Where to Find Message Analytics in Reflys?
- Log in to your Reflys Dashboard
- Go to Automation and then Automation Flow
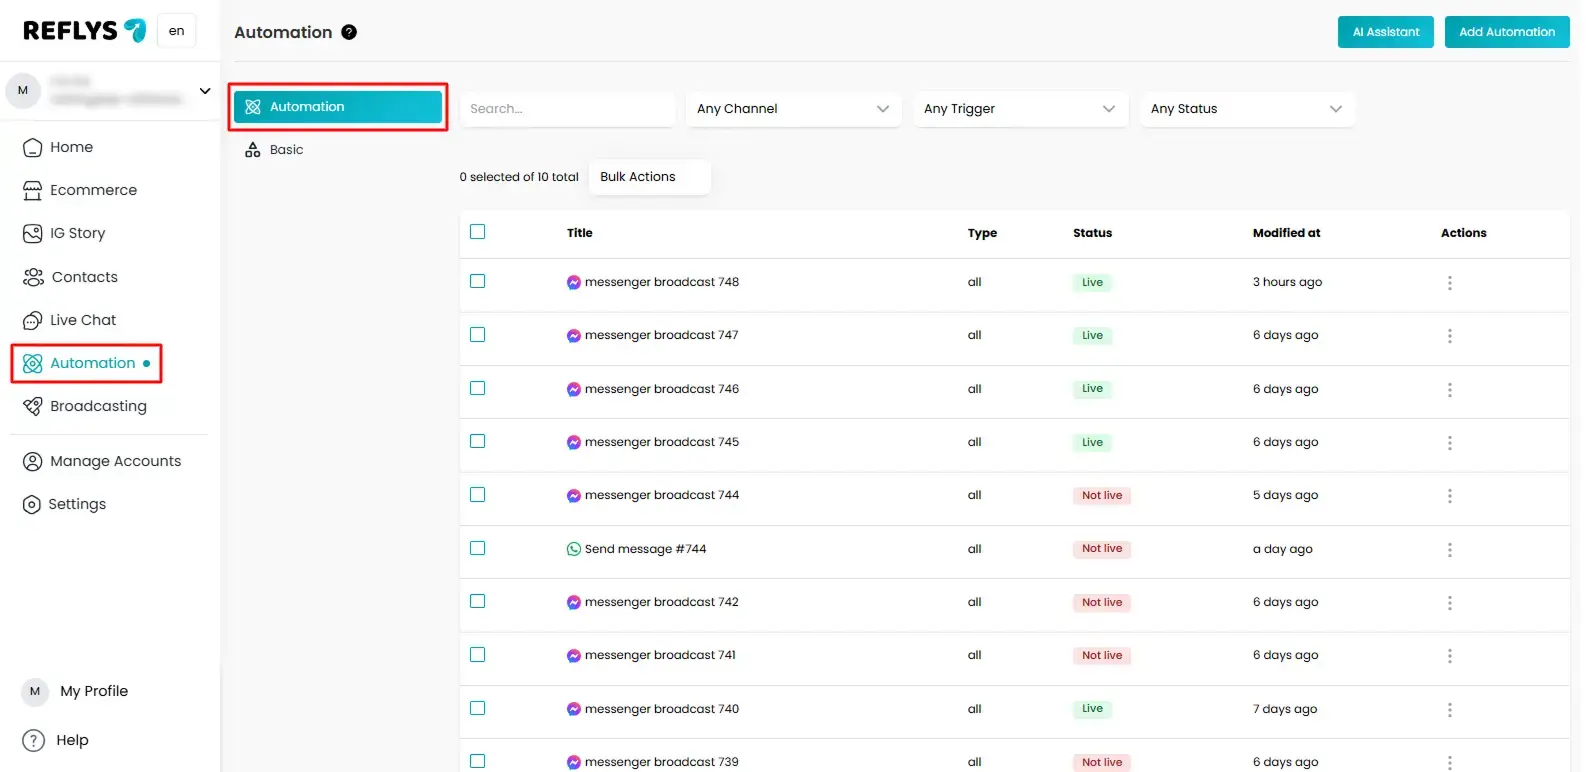
- Select the specific sequence or broadcast you want to evaluate and click the specific flow you want to view your analytics.
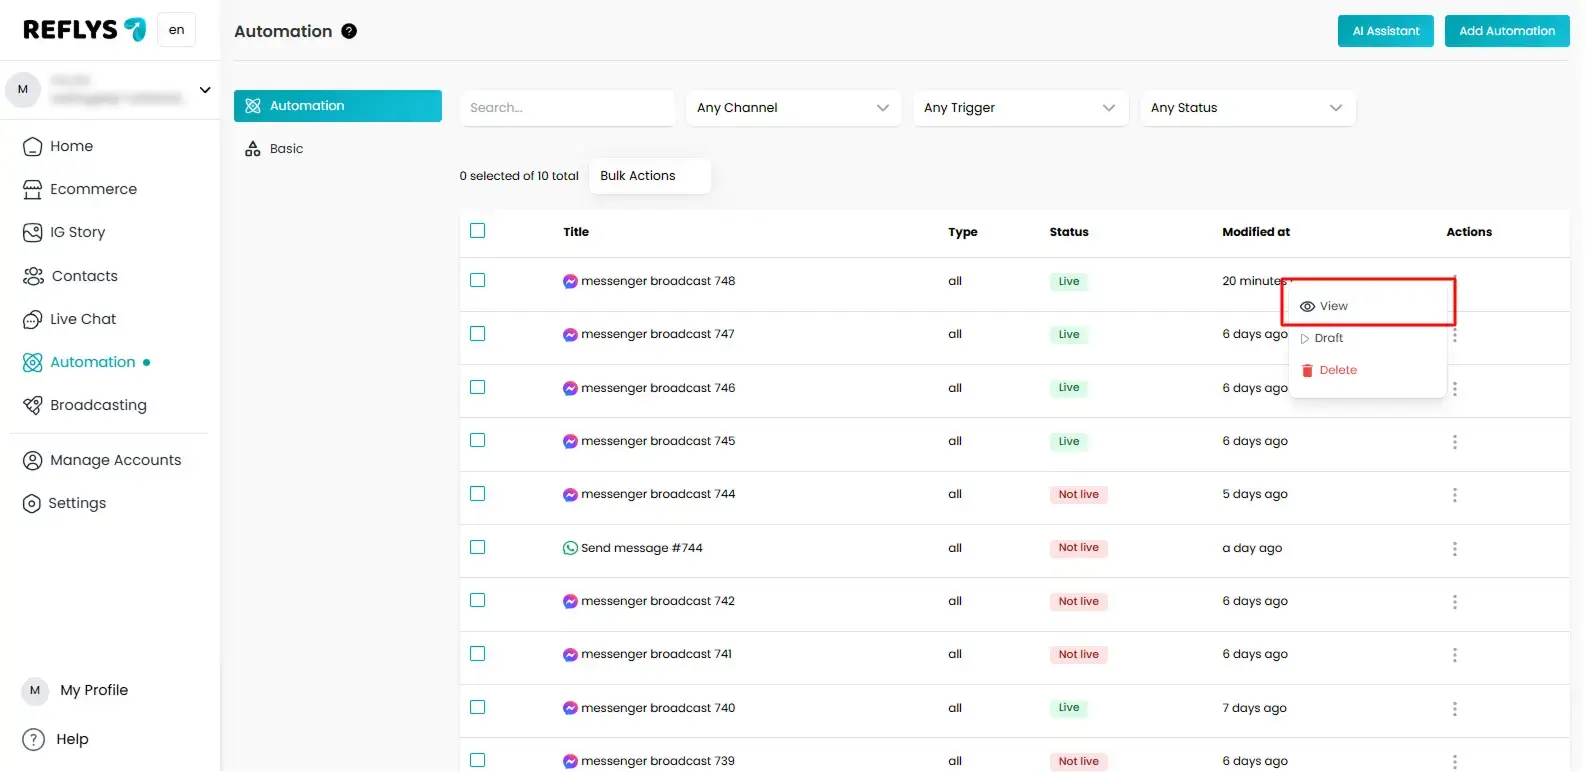
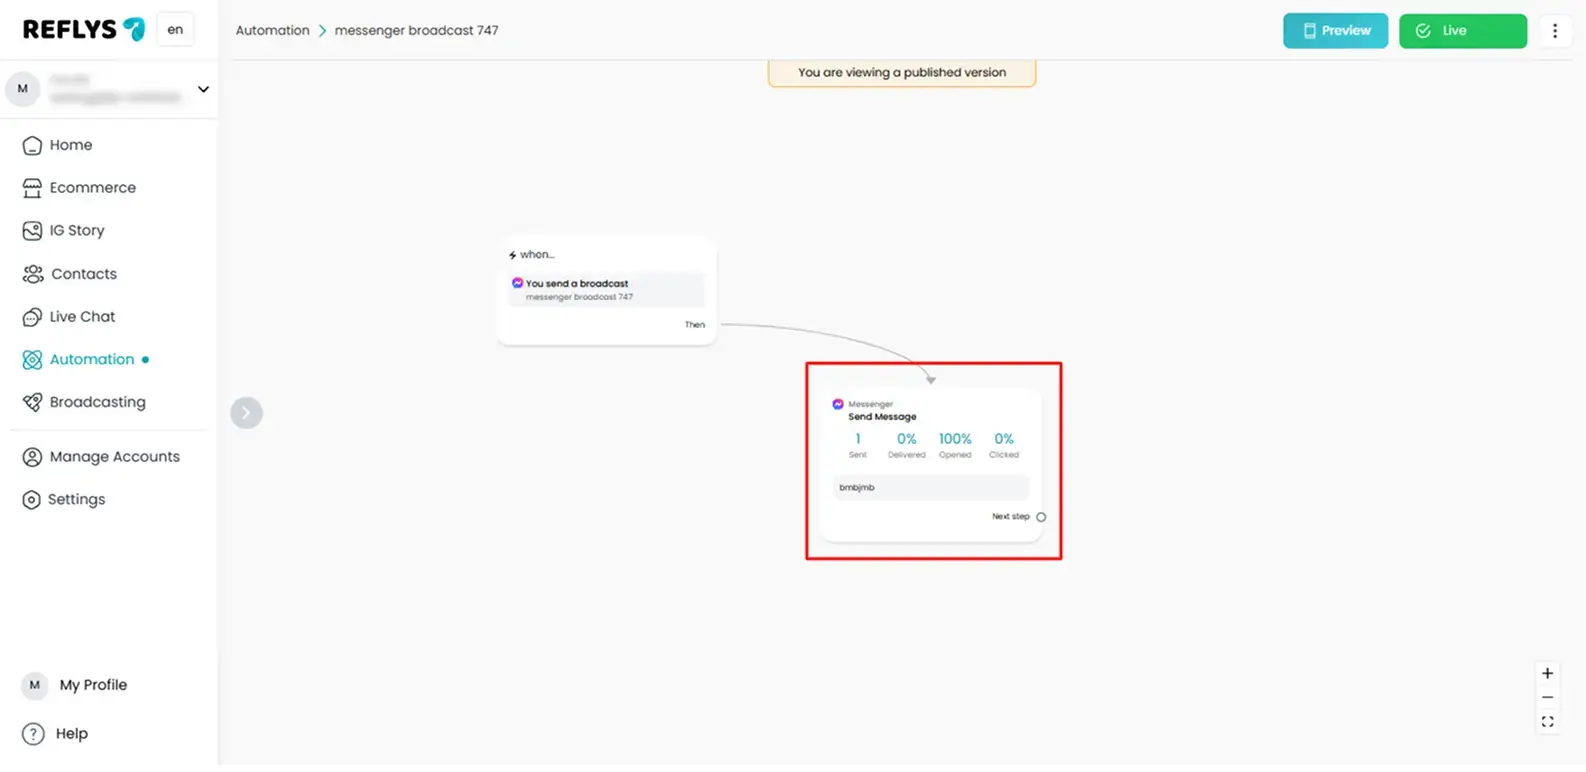
- Once open, you will see step-by-step performance metrics for every message inside that flow.
Important: Make sure your automation or broadcast is live before viewing your analytics.
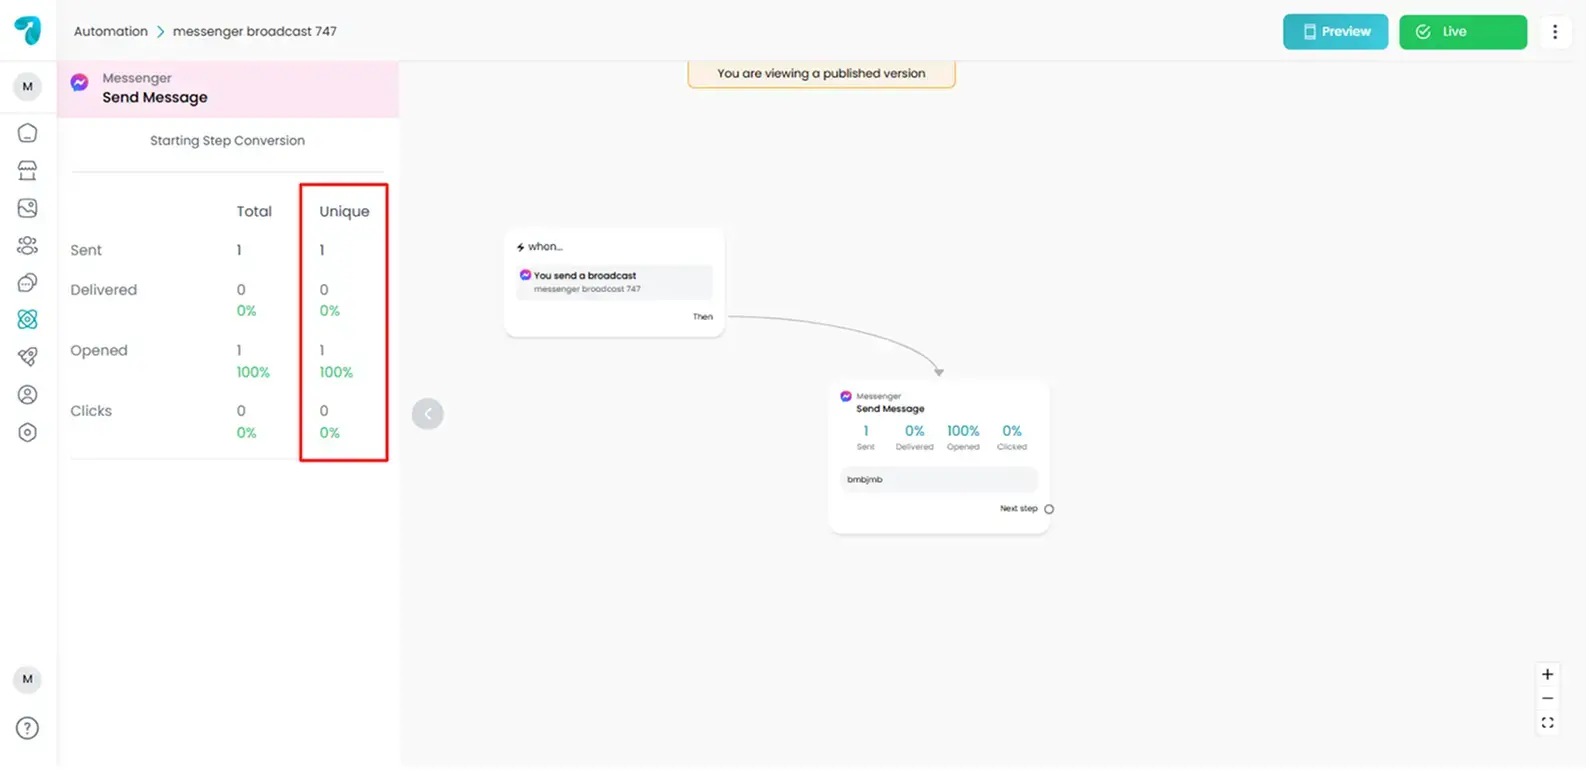
Understanding Step-Wise Message Metrics in Reflys
Below are the analytics you will see for each message block:
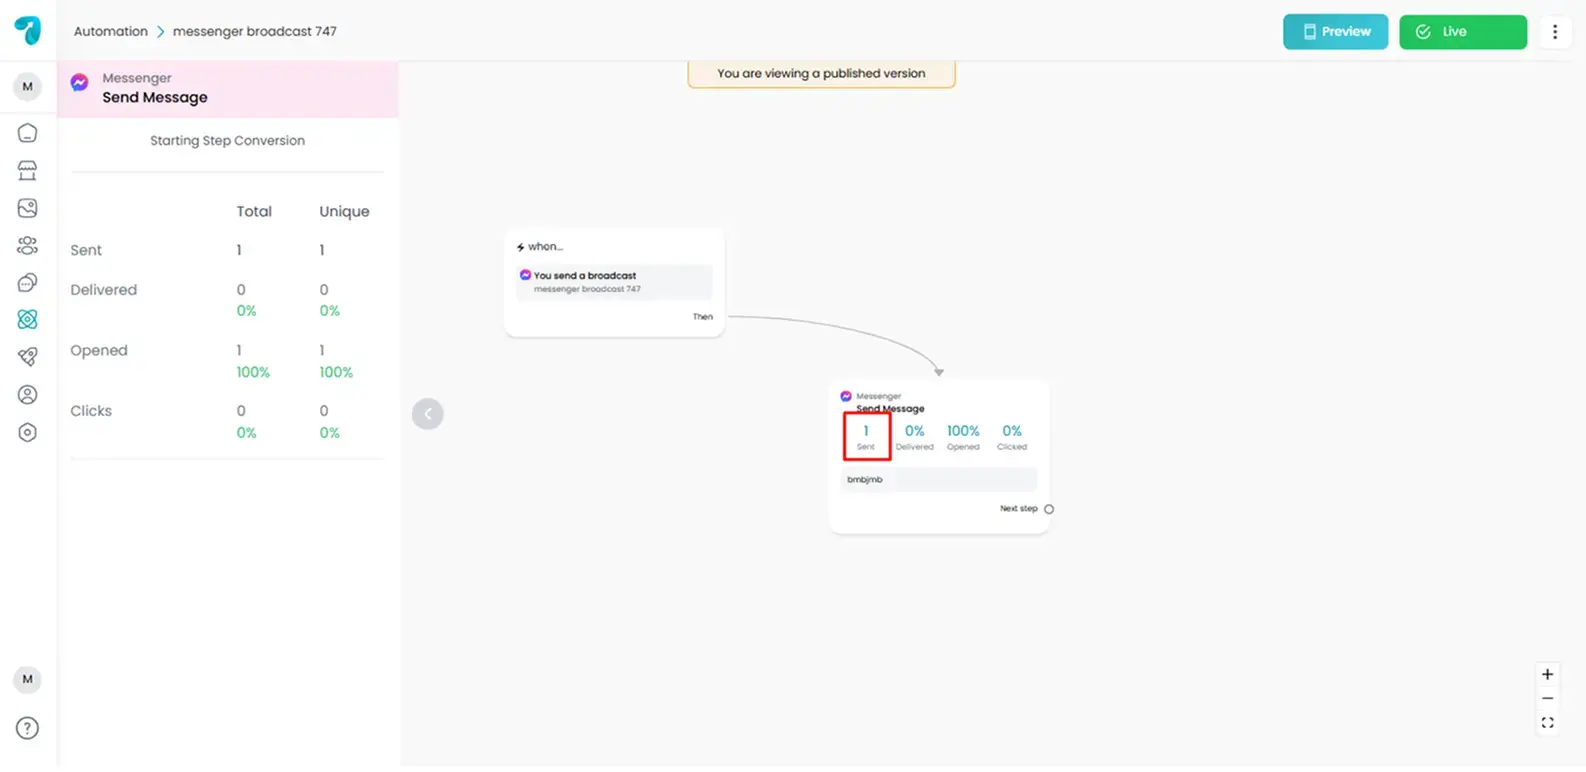
1. Sent
This metric shows the total number of messages Reflys successfully attempted to send from your campaign or flow.
It helps you confirm:
- The campaign was triggered correctly
- Users entered the flow as planned
2. Delivered
Delivered represents how many sent messages actually reached the user’s WhatsApp inbox.
It helps you measure:
- Delivery success rate
- Account health
- WhatsApp number quality
- Audience validity
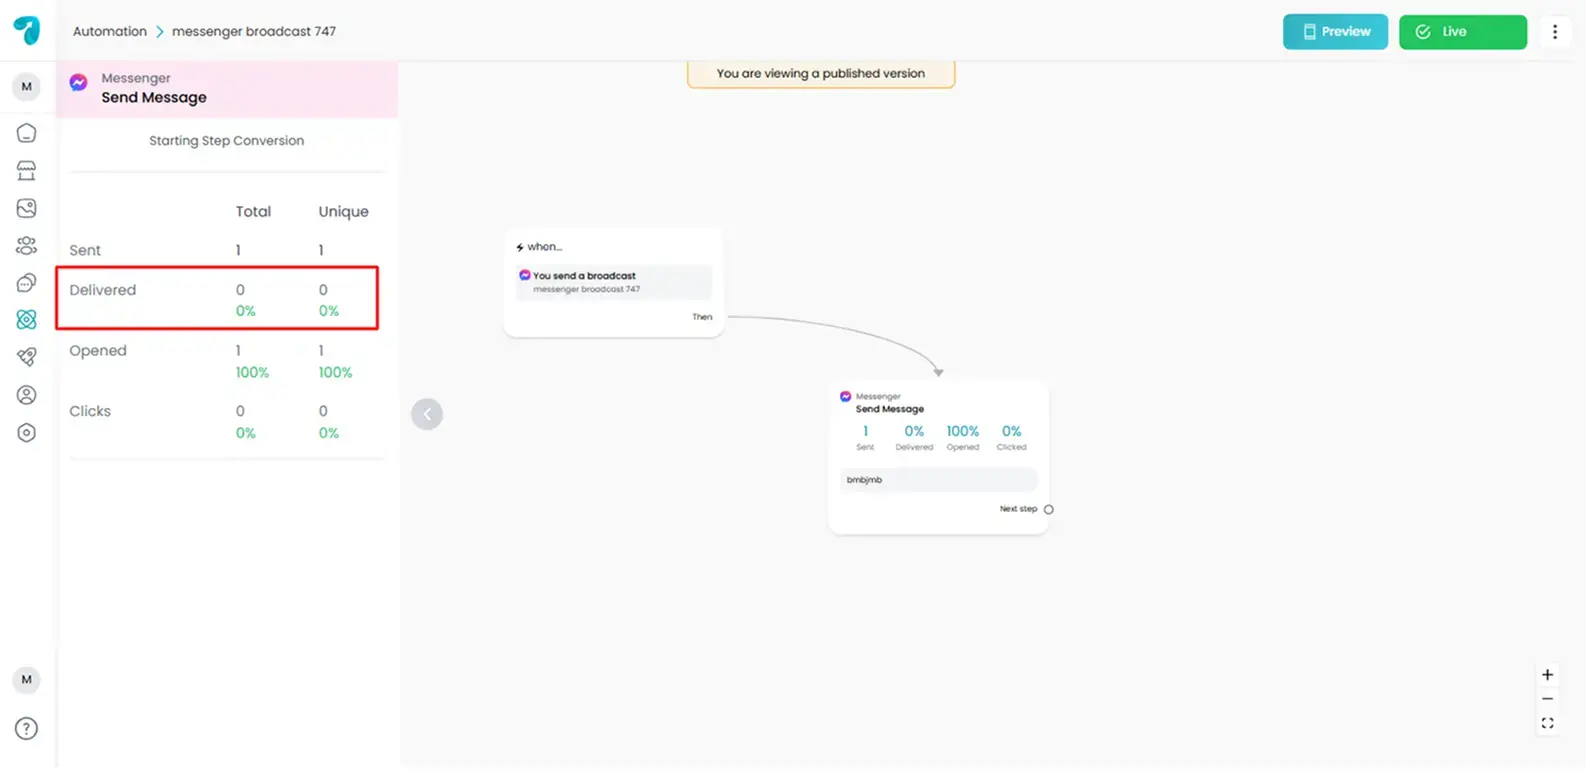
A low delivery rate may indicate invalid numbers, blocked users, or message restrictions.
3. Open Rates
Open rate shows how many people actually viewed your message inside WhatsApp.
This metric is useful for:
- Content testing
- Subject/header optimization
- Audience attention & timing patterns
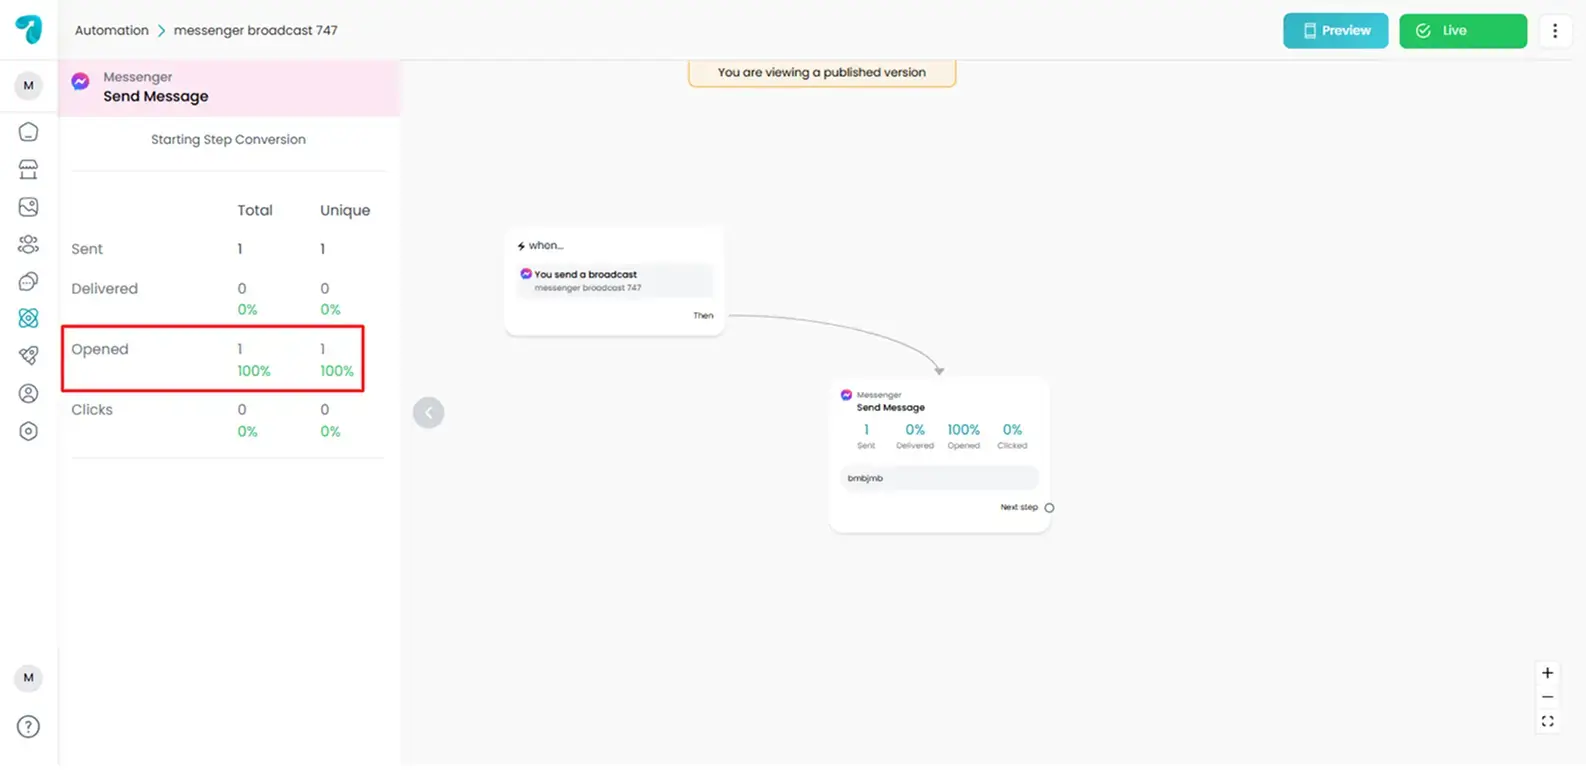
High open rate = strong messaging hooks and good targeting.
4. Click Rates
Click analytics track how many users tapped on your CTA button, link, or quick reply.
This helps you:
- Measure engagement
- Evaluate the offer strength
- Understand interest levels
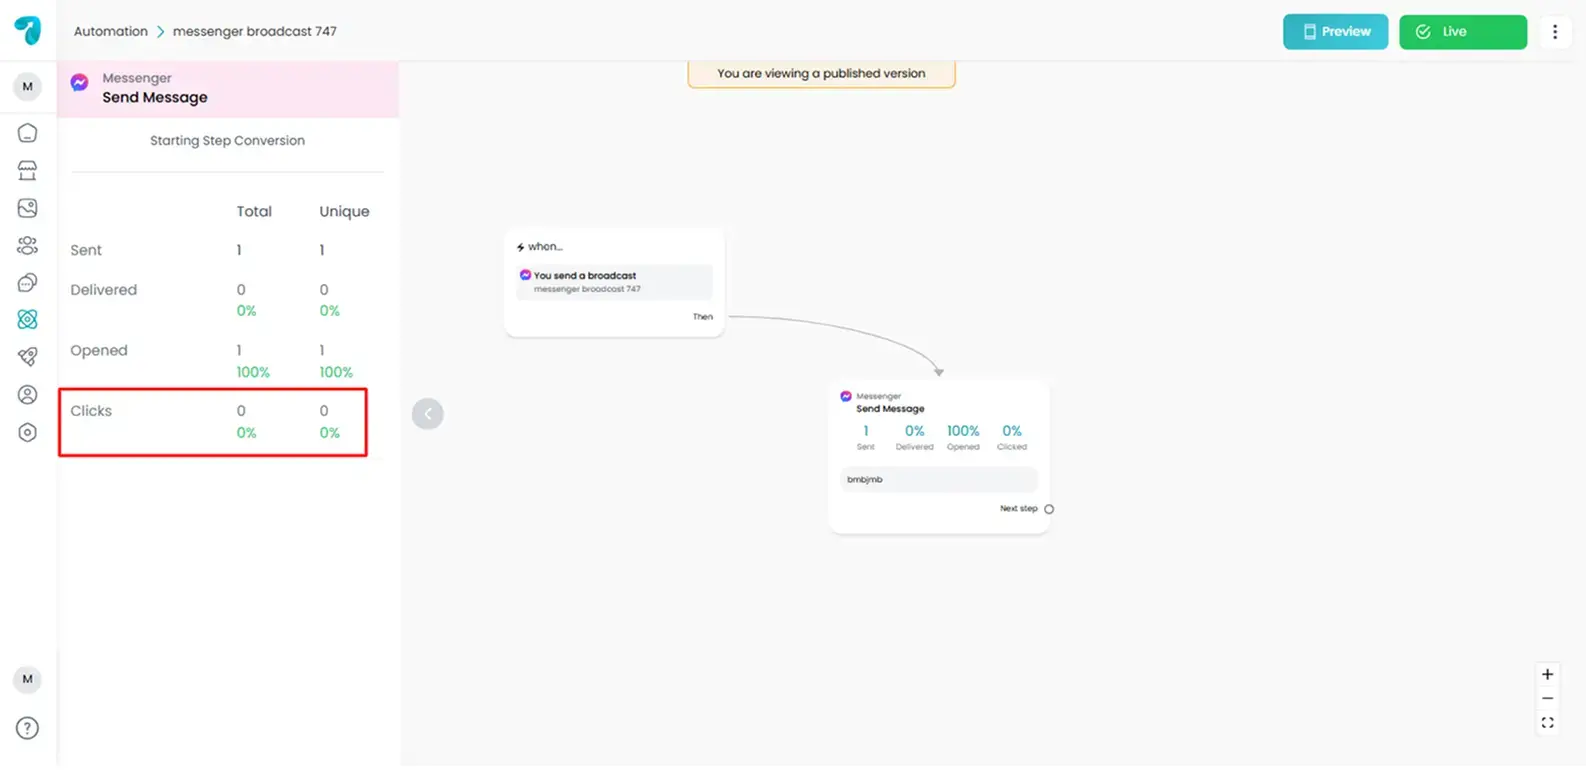
Clicks reveal how effective your message is at motivating user action.
5. Unique (Open / Click Data)
Unique metrics show how many individual users, not repeated interactions, engaged with a message.
Why unique matters:
- Prevents inflated results
- Shows real audience size
- Helps accurately track conversions
This is especially important for long-running sequences where users may re-enter flows.
How Are These Metrics Helpful to Improve Campaign Success?
Using step-wise analytics, you can:
Identify weak messages
If users open step 1 but ignore step 3, you know exactly where to rewrite.
Improve your call-to-action
Click data reveals whether users understand your button or offer.
Optimize message timing
Compare results by scheduled time or automated delay.
Test audience segments
Track who engages better: new leads, returning contacts, or referral traffic.
Enhance lead nurturing
Follow how leads move through your funnel step by step.
Conclusion
Reflys analytics are available directly inside every broadcast and automation flow. Use them regularly to track performance, fix drop-offs, and continuously improve how you communicate with your audience.
Each metric tells a different part of the story; together, they give you the complete picture.